2021. - 2025. g.
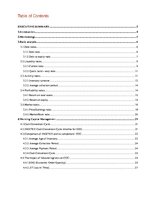
| Nr. | Sadaļas nosaukums | Lpp. |
| EXECUTIVE SUMMARY | i | |
| 1. | Introduction | 1 |
| 2. | Methodology | 2 |
| 3. | Ratio analysis | 3 |
| 3.1. | Debt ratios | 3 |
| 3.1.1. | Debt ratio | 3 |
| 3.1.2. | Debt to equity ratio | 4 |
| 3.2. | Liquidity ratios | 5 |
| 3.2.1. | Current ratio | 5 |
| 3.2.2. | Quick (acid – test) ratio | 6 |
| 3.3. | Activity ratios | 6 |
| 3.3.1. | Inventory turnover | 7 |
| 3.3.2. | Average collection period | 8 |
| 3.4. | Profitability ratios | 8 |
| 3.4.1. | Return on total assets | 9 |
| 3.4.2. | Return on equity | 9 |
| 3.5. | Market ratios | 10 |
| 3.5.1. | Price/Earnings ratio | 11 |
| 3.5.2. | Market/Book ratio | 12 |
| 4. | Working Capital Management | 13 |
| 4.1. | Cash Conversion Cycle | 13 |
| 4.2. | INDITEX Cash Conversion Cycle timeline for 2020 | 13 |
| 4.3. | Comparison of INDITEX and its competitors’ CCC | 14 |
| 4.3.1. | Average Age of Inventory | 14 |
| 4.3.2. | Average Collection Period | 15 |
| 4.3.3. | Average Payment Period | 15 |
| 4.3.4. | Cash Conversion Cycle | 16 |
| 4.4. | The impact of inbound logistics on CCC | 16 |
| 4.4.1. | EOQ (Economic Order Quantity) | 16 |
| 4.4.2. | JIT (Just in Time) | 17 |
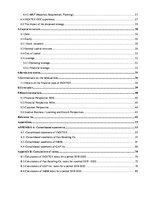
| 4.4.3. | MRP (Materials Requirement Planning) | 17 |
| 4.5. | INDITEX CCC experience | 17 |
| 4.6. | The impact of the proposed strategy | 18 |
| 5. | Capital structure | 19 |
| 5.1. | Debt | 19 |
| 5.2. | Equity | 19 |
| 5.2.1. | Stock valuation | 19 |
| 5.3. | Optimal capital structure | 19 |
| 5.4. | Cost of capital | 20 |
| 5.5. | Leverage | 21 |
| 5.5.1. | Operating leverage | 21 |
| 5.5.2. | Financial leverage | 21 |
| 6. | Bonds and stocks | 23 |
| 7. | Commentary on the news article | 24 |
| 7.1. | Impacts on the financial state of INDITEX | 24 |
| 8. | Conclusion | 26 |
| 9. | Recommendations | 27 |
| 9.1. | Financial Perspective. ROE | 27 |
| 9.2. | Financial Perspective. ROA | 27 |
| 9.3. | Customer Perspective | 27 |
| 9.4. | Internal Business / Learning and Growth Perspectives | 28 |
| Reference list | 29 | |
| Appendices | 36 | |
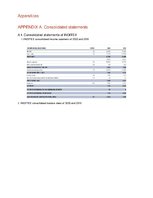
| APPENDIX A: Consolidated statements | 36 | |
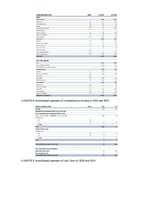
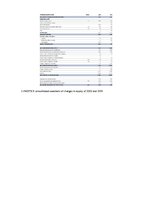
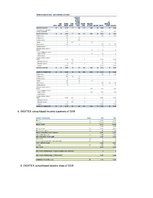
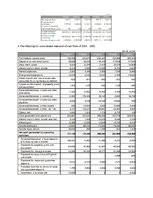
| A.1. | Consolidated statements of INDITEX | 36 |
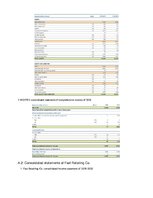
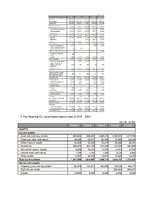
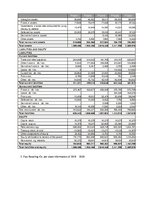
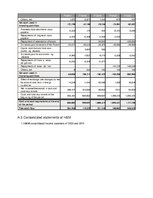
| A.2. | Consolidated statements of Fast Retailing Co | 40 |
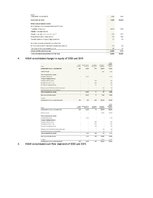
| A.3. | Consolidated statements of H&M | 44 |
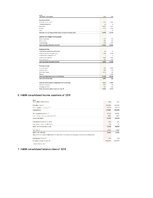
| A.4. | Consolidated statements of GAP Inc | 49 |
| Appendix B: Calculations of ratios | 53 | |
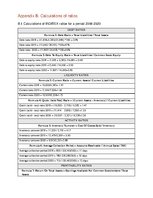
| B.1. | Calculations of INDITEX ratios for a period 2018-2020 | 53 |
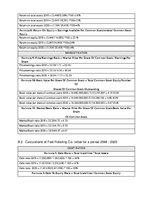
| B.2. | Calculations of Fast Retailing Co. ratios for a period 2018 - 2020 | 54 |
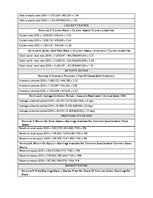
| B.3. | Calculations of GAP Inc. ratios for a period 2018-2020 | 56 |
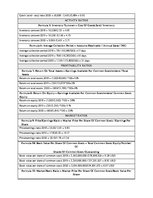
| B.4. | Calculations of H&M ratios for a period 2018-2020 | 58 |
| Appendix C: Calculations of cash conversion cycle for 2020 | 60 | |
| Appendix D: Calculations of the degree of financial and operating leverage for 2020 | 61 | |
| Appendix E: Article that impacts the financial performance of INDITEX | 62 | |
| Appendix F: Industry analysis | 64 | |
| F.1. | Porter`s Five Forces analysis | 64 |
| F.2. | SWOT Analysis of INDITEX | 64 |
INDITEX company had been chosen as a multinational, parent enterprise for this financial analysis. The main purpose of this financial analysis is to understand the effects of decisions made based on the financial ratios, inbound logistics, capital structure.
Combined ratio analysis was conducted, therefore, INDITEX was compared to its main competitors– GAP Inc., Fast Retailing Co., H&M, using the data from consolidated statements. Companies were compared in terms of debt, liquidity, activity, profitability, market ratios. Analyzing the results of calculations, INDITEX took leading positions almost in all ratios. However, the COVID – 19 noticeably affected the fashion retail industry. Therefore, the inventory turnover decreased from 5.50 to 3.88; ROA from 16% to 4% in 2020; ROE decreased by 20%.…
Financial analysis of a multinational enterprise - INDITEX INDITEX company had been chosen as a multinational, parent enterprise for this financial analysis. The main purpose of this financial analysis is to understand the effects of decisions made based on the financial ratios, inbound logistics, capital structure.

