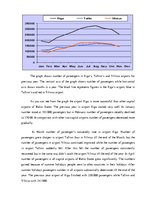
The graph shows number of passengers in Riga’s, Tallinn’s and Vilnius airports for previous year. The vertical axis of the graph shows number of passengers while horizontal axis shows months in a year. The black line represents figures in the Riga’s airport, blue in Tallinn’s and red in Vilnius airport.
As you can see from the graph the airport Riga is more successful than other capital airports of Baltic States. The previous year in airport Riga started very well. In January number stood at 192 000 passengers but in February number of passengers steadily declined to 170 00. In comparison with other two capital airports number of passengers decreased more gradually.…