Prioritization of risks
A business needs to prioritize risks based on their calculated impact and probability of occurrence. To assess the probability of risks and their potential impact a number of various approaches can be taken. One example is risk maps.
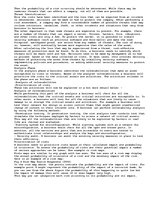
Risks maps are similar to any graph with two axes. The two axes of a risk map display the annual probability of occurrence of a risk and the monetary impact of the risk. Here is an example of a risk map:
Fig 4 Risk Map Source Roopendra (2002)
In the risk map above, the points indicate the probability and the impact of risks. For example point D might represent the probability of the impact of a terrorist bomb. As you can see from the above figure the probability of this happening is quite low but the impact of damage this will cause if it does happen very high.
This way you can categorize each risk according to its probability and its impact.
…